In previous posts, we walked through how to A/B test a Sitecore form to optimize for conversions. Part 1 talked about duplicating the form, editing the variant, and creating a component test, while part 2 discussed the details of setting the test parameters and starting the test. Now it is time to talk about the results of the test and how to put them to action.
Where can I view test results in Sitecore?
To see the results or progress of an active test:
- In the Experience Editor, navigate to the page where the test is (in our example, it is the page that has the lead generation form). In the ribbon, go to the optimization tab.
Because the test is active/running, you will see:
- A red dot on the optimization tab indicating that there’s an active test
- The status showing Active test followed by the number of visitors required for the test to be completed and the number of days it will take to get this number of visitors (if there is enough historical data)
- In the Optimization tab, click Test result to show the test result dialog box
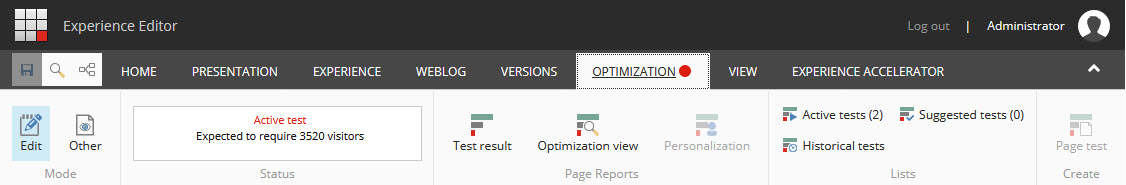
The Sitecore test result dialog box

The test result dialog shows the following:
- Overview
- Best experience effect
This shows the increase in the trailing value per visit in the best experience vs the original experience as a percentage. It is important to view the effect of the tested experiences on the trailing value per visit even when the test objective/hypothesis is tied to a specific goal/conversion. - Confidence
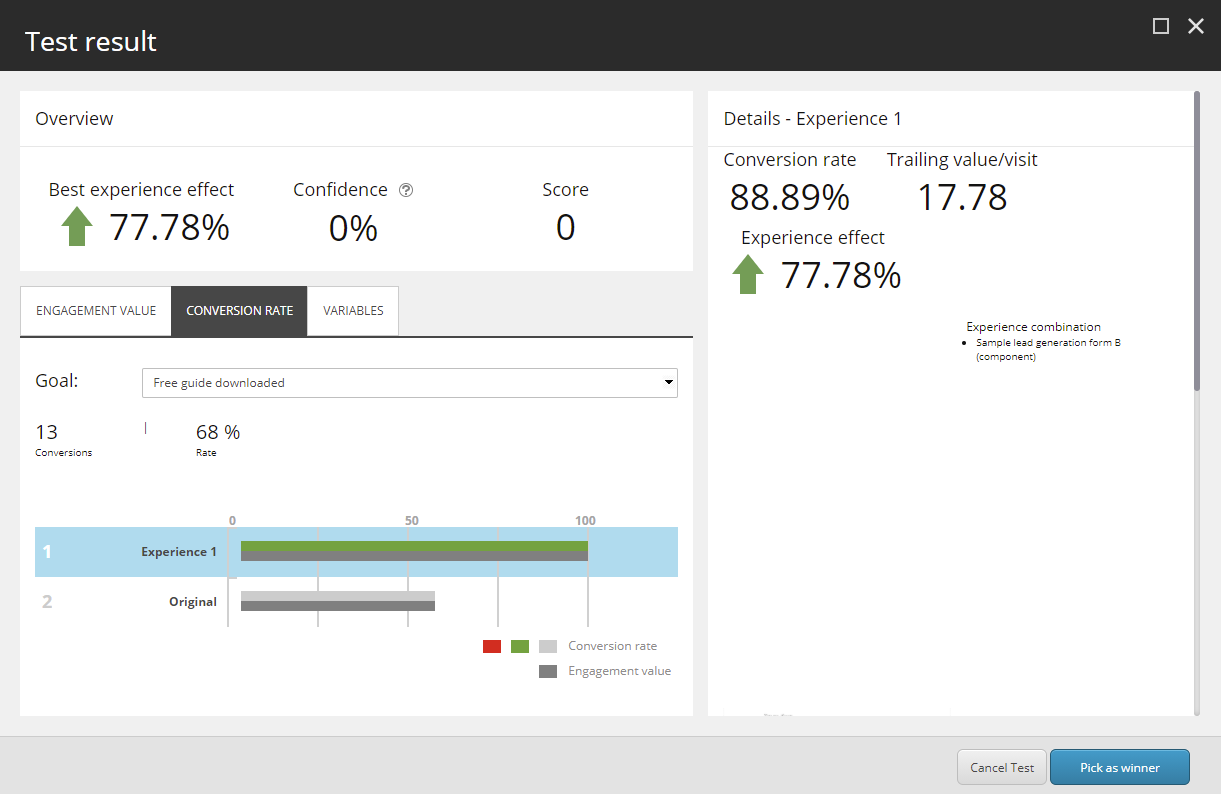
This shows the statistical confidence level in the test result. It shows 0 when there are fewer than 100 visitors. - Score
This is a score assigned to the creator of the test based on their guess/hypothesis. It is not an indicator of the credibility of the test results.
In our example, the best experience happens to be Experience 1, which is the form with the Submit to Download your free Guide! Button. The Overview section shows that the trailing value per visit increased by 77.78% compared to the original experience. Confidence shows 0 because this is a sample test and there were fewer than 100 visitors at the time the screenshot was taken.
If experience 1 didn’t increase the trailing engagement value per visit, the original experience would have been the best experience and therefore the Best experience effect would have shown 0.
- Best experience effect
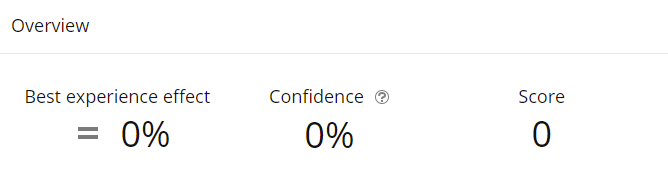
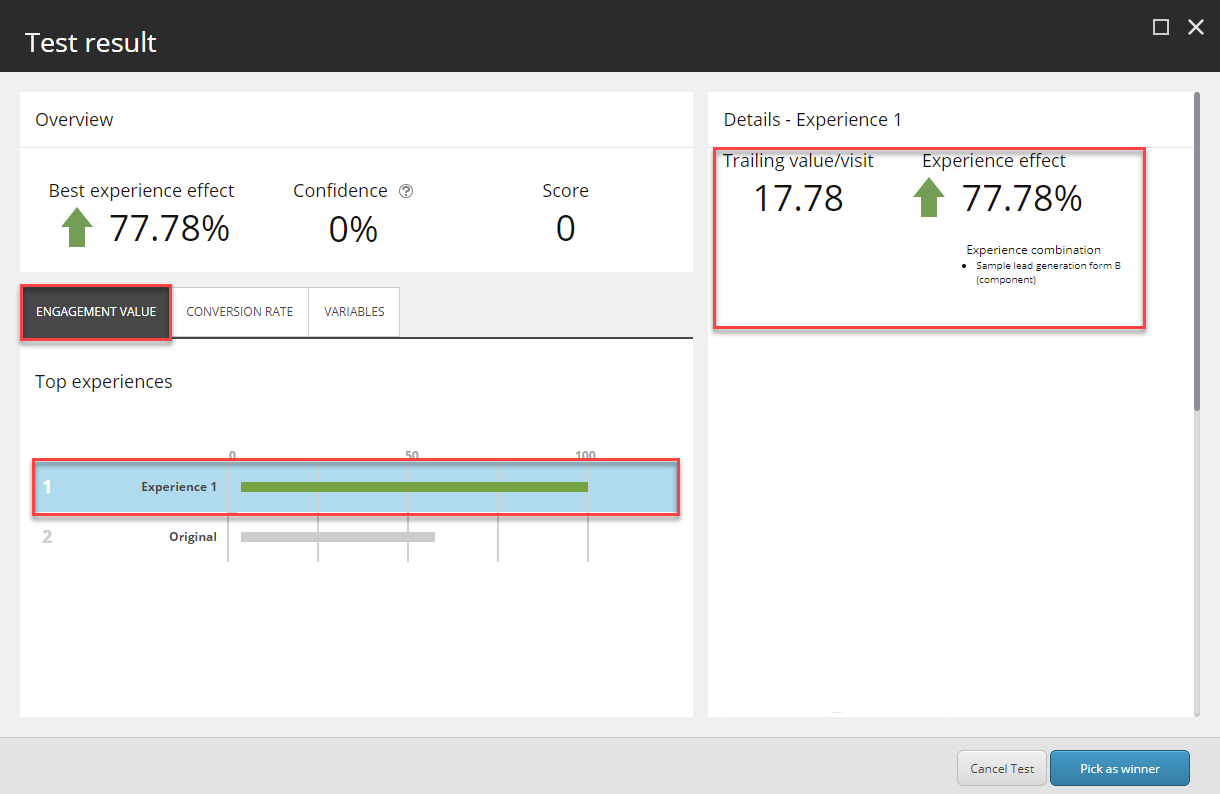
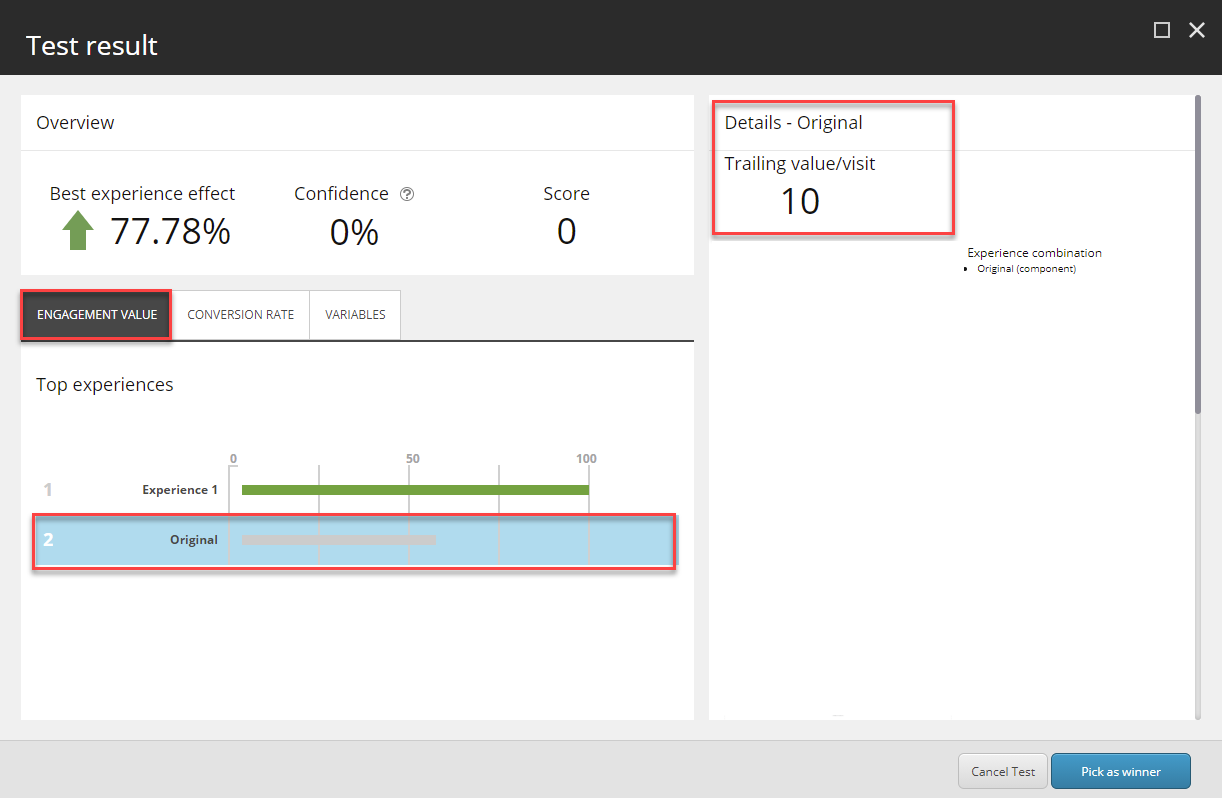
- The Engagement Value tab
The Engagement Value tab shows the performance of each experience in terms of engagement value in the form of graphs. The experience with the highest engagement value is given a 100, and the rest are measured against it.
In our example, Experience 1 (the form with the descriptive button copy) shows a 100 because it is the one with the highest engagement value. The bar is green to indicate that it is performing better than the original experience in terms of engagement value. The Details box on the right shows the trailing value per visit at 17.78 and that it increased by 77.78% in comparison to the original experience.
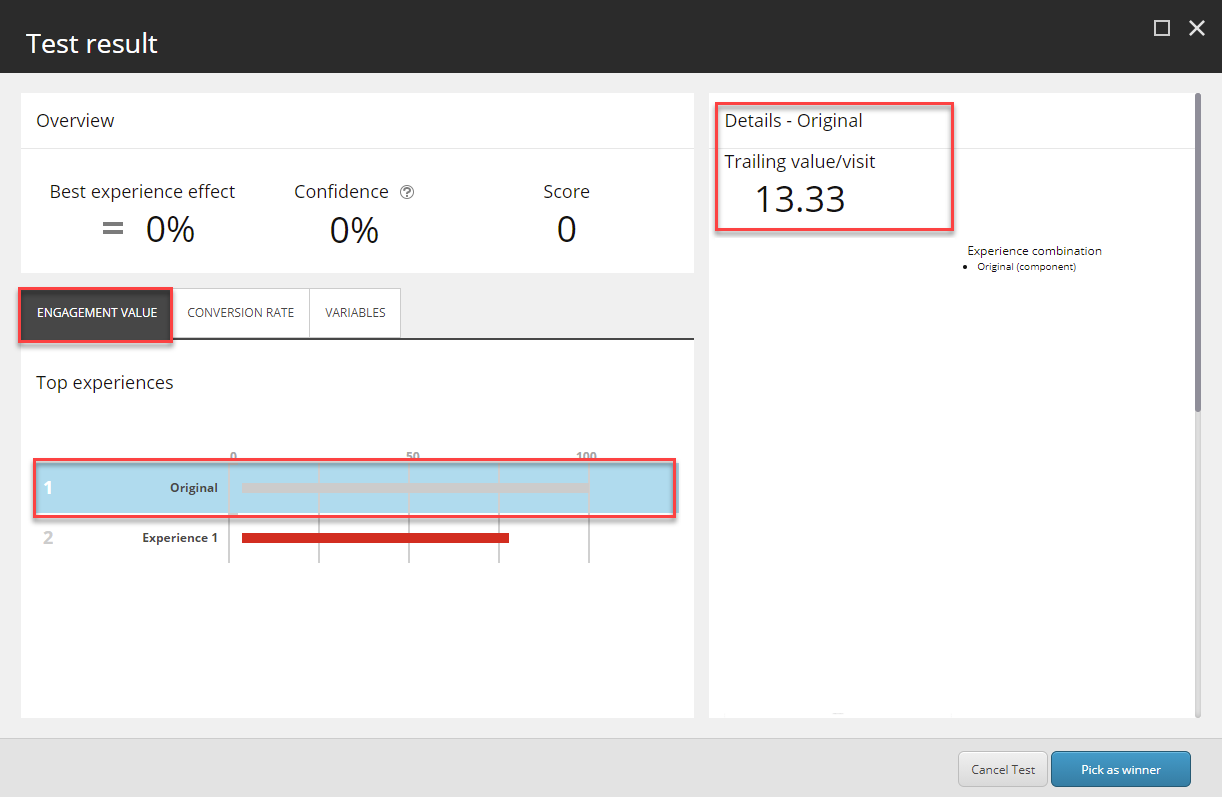
Clicking on the original experience shows you more details about it.
The original experience is measured against experience 1 as 56.25% (Engagement Value for the original experience / Engagement Value of experience 1) x 100)=(10/17.78*100). The bar is grey to indicate it is the original experience.
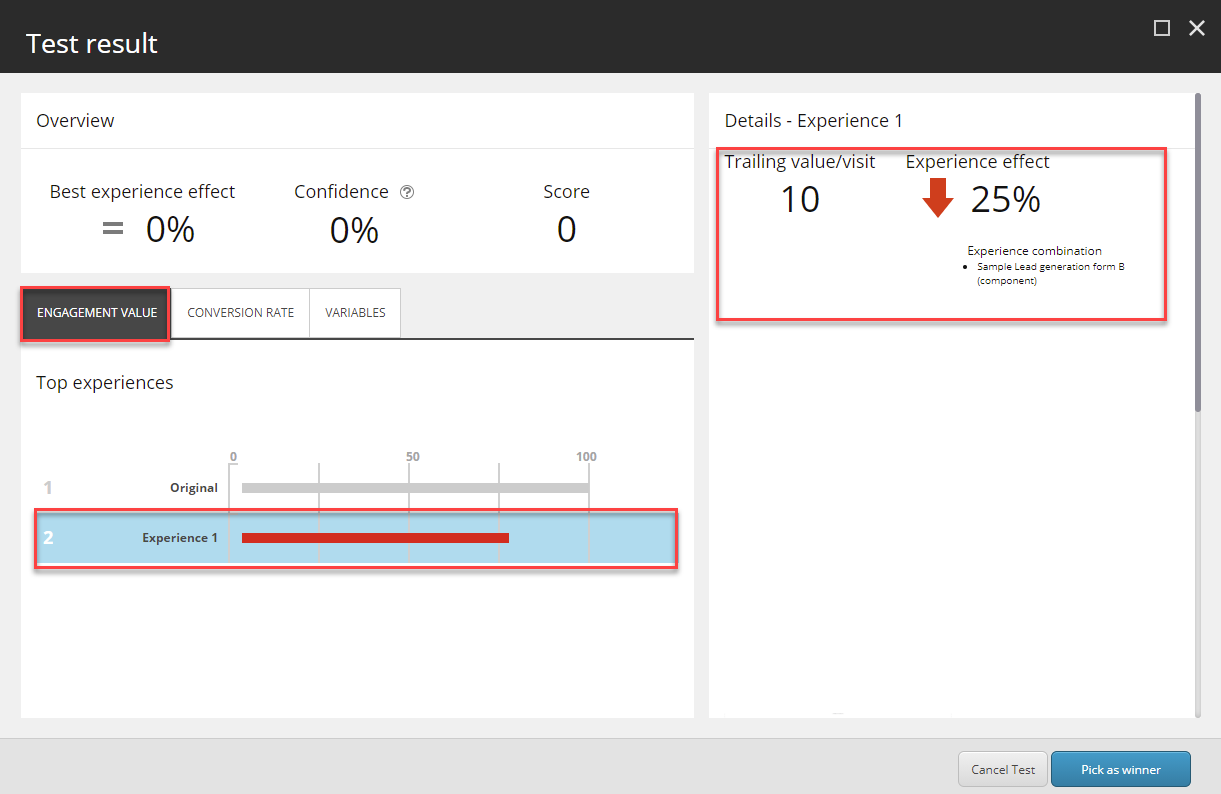
If experience 1 caused a decrease in the engagement value compared to the original experience, the original bar would be gray at 100 and the experience 1 bar would be red showing that it is performing worse than the original experience. The details on the right would show the value per visit and how much it decreased.
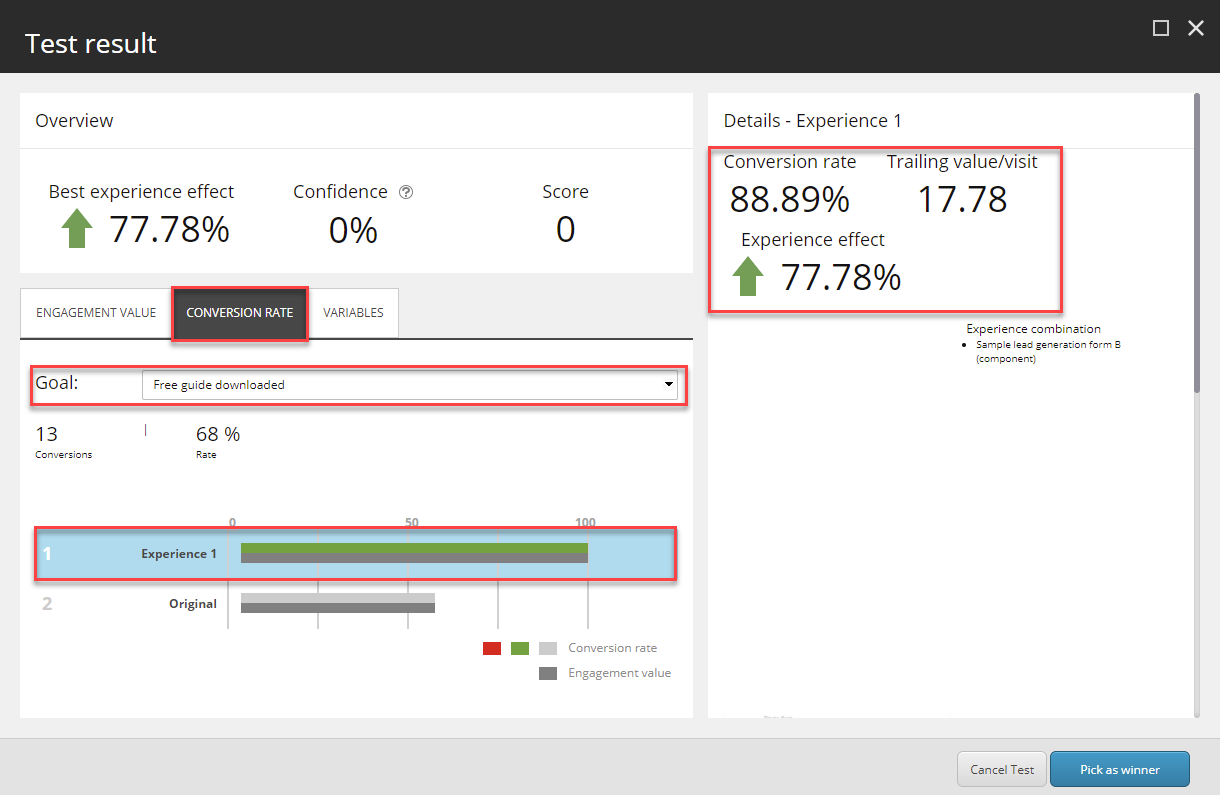
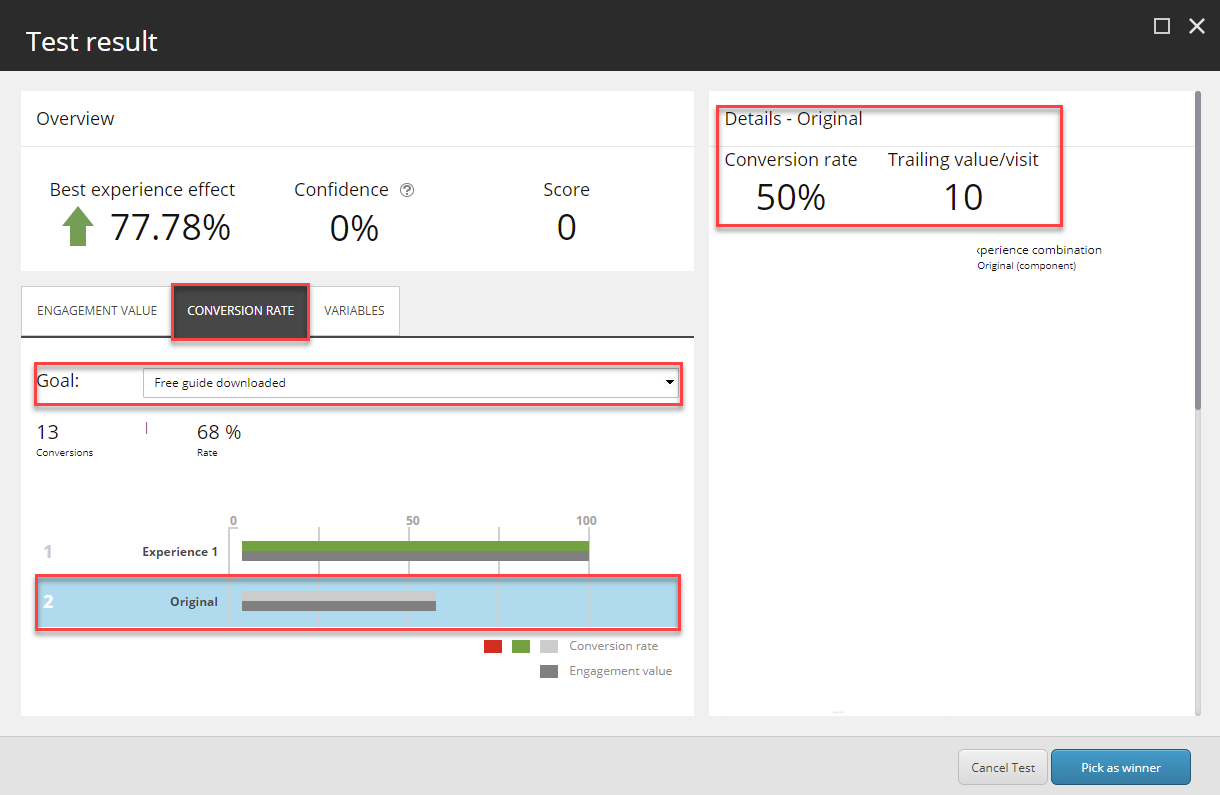
- The Conversion Rate tab
This is where you would want to look when you are testing experiences to see which one triggers goals better = gets higher conversion rates. Click the Conversion rate tab, and from the drop-down menu, select the goal for which you would like to see the conversion rate (the goal you have set as the test objective should be selected by default).
In our example, we wanted to see the effect of changing the copy of the button on submitting the form which triggers the Free guide downloaded goal. So that is the goal we selected.
The experience 1 bar is green at 100. The Details box on the right shows that the conversion rate to be 88.89%, which is an increase of 77.78% over the original experience. It also shows the trailing value per visit to be 17.78. This view is useful in showing the full picture because it shows both the conversion rate and value per visit as graphs and numbers.
Clicking on the original experience shows more details about it.
The bar is gray to indicate it is the original experience. The Details box shows the conversion rate at 50%, in addition to the trailing value per visit at 10.
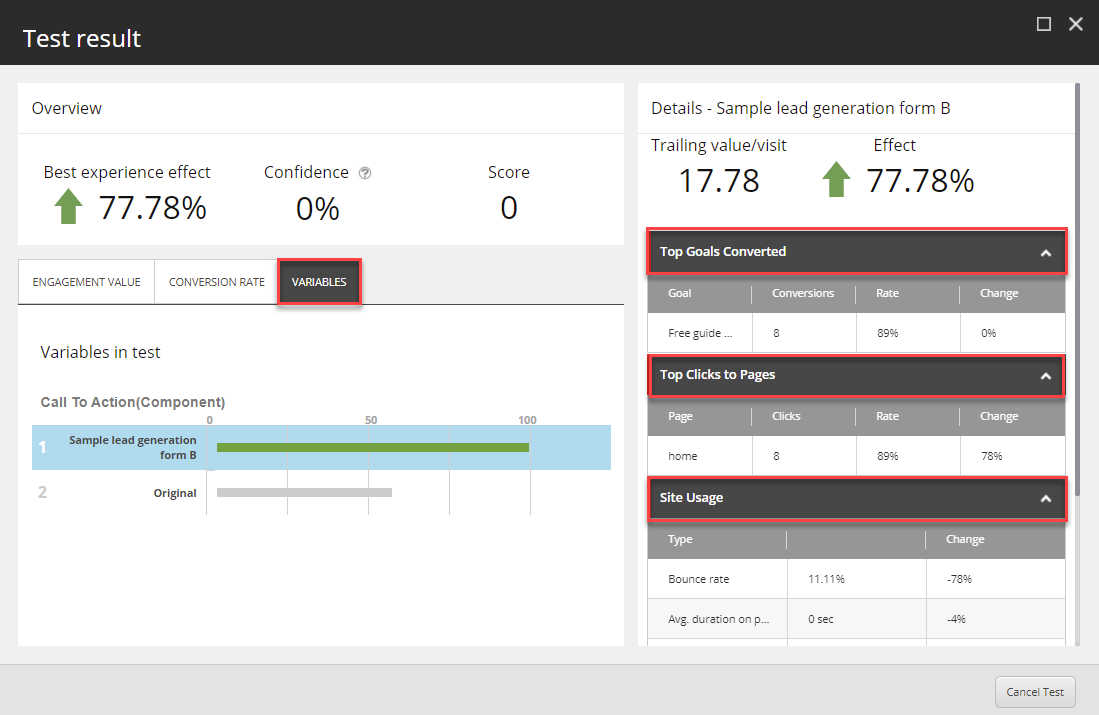
- The Variables tab
The Variables tab shows a list of the variables in the test and the following details on each of them:
- Top goals converted – the goals triggered by the visitors exposed to that particular experience of the test, how many times they were triggered, the conversion rate, and the change in the conversion rate caused by the experience
- Top clicks to pages - the names of pages users navigated to after being exposed to that experience, how many times each page was clicked/navigated to, the percentage of visitors that navigated to each page, and the change in that percentage caused by the experience
- Site usage -the bounce rate, the average time spent on the page, the average time spent on the site, and the average of pageviews per visit
How to use the test results to pick a winner
Last but not least, in the lower-right corner of the Test results dialog box, there are two buttons:
- Cancel Test – which cancels the test and reverts back to showing only the original experience.
- Pick as winner – which ends the test and specifies the selected experience as the winner (the one that will show up from that point forward). This overrules the test objective defined for the test.
Our test results show clearly that the new experience (experience 1 which is the form with the button copy of Submit to Download your free Guide!) has a higher conversion rate for the Free guide downloaded goal. At the same time, that same experience gets higher trailing engagement value as we have expected. This confirms our hypothesis. The test still needs more time to get more data and increase the confidence level. We can wait until that happens and Sitecore selects the winner. Or we can select it manually by selecting experience 1 and clicking Pick as winner to end the test and make the form show the new button copy to all users.
And there you have it, how to gain insights from the test results and optimize your Sitecore form for conversions. If you have any questions about optimization and testing using Sitecore, please let me know in the comments below.