In a previous post, we explored Sitecore’s Path Analyzer, the application that creates maps as visual representation of the different paths that users take as they navigate through your website. In this post, we’ll explore the Page Analyzer. Let’s jump right in.
What’s Sitecore Page Analyzer?
The Page Analyzer is a functionality in the Path Analyzer that allows you to focus on the paths that lead to a specific page and out of it. In other words, it helps you understand how visitors get to a specific page (or another type of destination like a goal for example) and what they do afterwards. It also allows you to see the paths that have accrued the highest traffic (visits) and most engagement value per visit, allowing you to identify good paths and not-so-good ones. Once you’ve identified them, you can drill down to a particular one and explore its details and think of ways to optimize.
How to access Sitecore Page Analyzer?
The Page Analyzer is a functionality of Sitecore’s Path Analyzer. To access it:
- In the Path Analyzer, click on a node/page you’d like to analyze
- Click Open in Page Analyzer
A walk-through of Page Analyzer
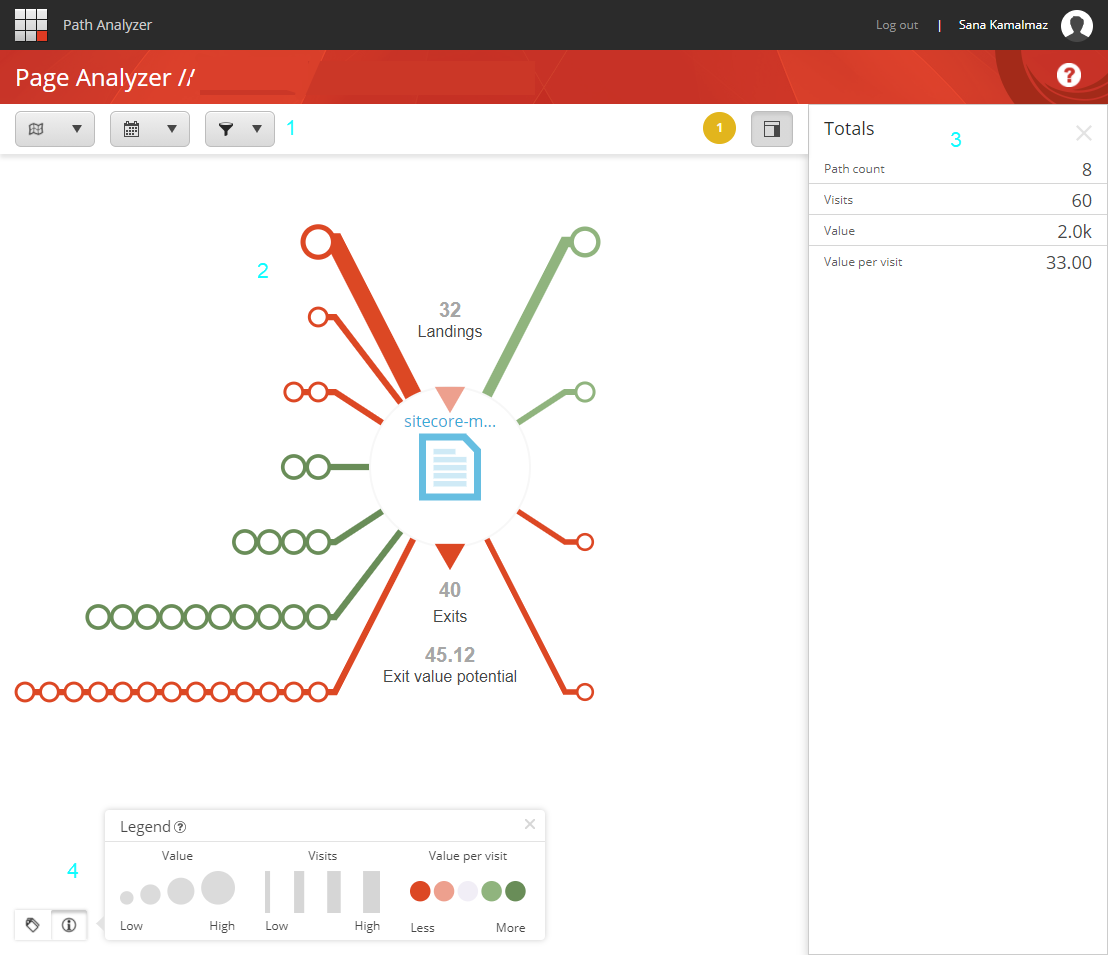
As you click on a page and open it in the Page Analyzer, the Page Analyzer will open in a new tab, and you’ll see:
- The control bar where you can select a date range, apply filters and control other options
- A visual representation of how users move to and from the page you are analyzing
- The context pane which shows the Totals or more details depending on what’s selected
- The Label and Legend buttons at the bottom-right corner
How to understand the visualization
The page
The Page Analyzer shows the currently selected page as a circle with a page icon in the middle. The page is placed at the center and the paths leading in and out of it are shown as lines.
Landings
The Landings shows how many paths started at the currently selected page.
Exits
The Exits shows how many paths ended by the user exiting from the currently selected page. It also shows total accumulated exit value potential, which is a metric that indicates the potential engagement value that could be gained on average through optimization.
Incoming paths
The lines at the left side of the page represent incoming paths. The circles on these lines represent nodes on that path (in page maps, nodes represent pages).
Outgoing paths
The lines at the right side of the page represent outgoing paths. The circles on these lines represent nodes on that path (in page maps, nodes represent pages). To keep visualization simple, only the next page is shown on the outgoing paths.
Line thickness
The line thickness represents the number of visits coming from a specific path to the page. The thicker the line, the more visits are arriving at the page through that path.
Line color
The line color represents the value per visit on this specific path. The darker the shade of green the path is, the higher the value per visit is compared to other paths. Paths with the least value per visit are shown in red.
Node size
The size of each of the nodes represents the total engagement value on the path that leads to the currently selected page. The larger the circle, the higher the engagement value.
The Context Pane
The Context Pane area shows the aggregated totals for the visits, value, and value per visit metrics, as well as the total path count. If you hover over a particular path, the totals area shows the metrics from that path.
And there you have it, a quick walkthrough of Sitecore’s Page Analyzer.